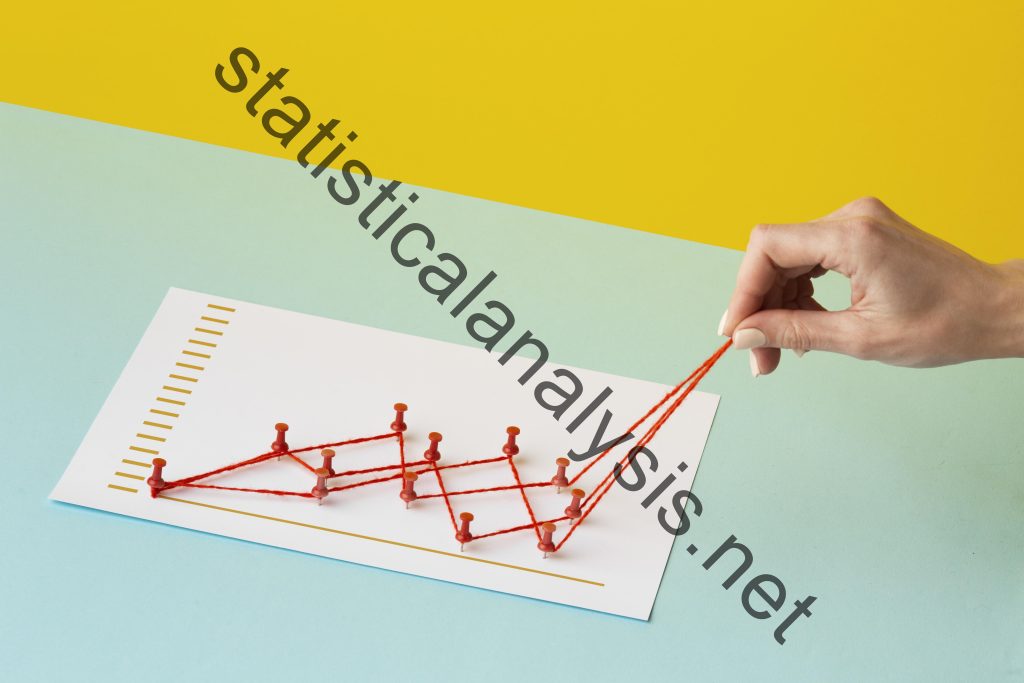
Using Statistical Analysis to Predict Trends and Patterns
In today's data-driven world, the ability to analyze and interpret large sets of data is crucial for making informed decisions. Statistical analysis is a powerful tool that can help businesses and organizations uncover trends, patterns, and insights from data. By using statistical techniques, such as regression analysis, time series analysis, and clustering, analysts can make predictions about future outcomes and identify areas for improvement. In this article, we will explore how statistical analysis can be used to predict trends and patterns, and discuss some common techniques used in the process.
Understanding Statistical Analysis
Statistical analysis is the process of collecting, cleaning, and analyzing data to uncover patterns and trends. It involves using mathematical models and techniques to summarize and interpret data, and make informed decisions based on the results. Statistical analysis can be used in a variety of fields, including finance, marketing, healthcare, and more. By using statistical methods, analysts can identify relationships between variables, make predictions about future outcomes, and test hypotheses to support decision-making.
Predicting Trends with Regression Analysis
One common technique used in statistical analysis is regression analysis. Regression analysis is a statistical method that examines the relationship between one dependent variable and one or more independent variables. By analyzing the data, analysts can create a regression model that predicts the value of the dependent variable based on the values of the independent variables. This can help businesses and organizations predict trends, identify patterns, and make informed decisions based on the results.
Analyzing Time Series Data
Another important aspect of statistical analysis is analyzing time series data. Time series analysis is a statistical technique that examines data points collected over time to identify patterns and trends. By analyzing time series data, analysts can make predictions about future outcomes, detect seasonality and trends, and identify anomalies in the data. Time series analysis is commonly used in finance, economics, and other fields to forecast stock prices, sales figures, and other time-dependent variables.
Identifying Patterns with Clustering
Clustering is another powerful technique used in statistical analysis to identify patterns and group similar data points together. Clustering algorithms group data points based on similarity, allowing analysts to identify patterns and trends in the data. By using clustering techniques, analysts can segment customers based on their behavior, group products based on their features, and identify anomalies in the data. Clustering is a valuable tool for businesses and organizations looking to uncover hidden patterns and insights in their data.
Conclusion
Statistical analysis is a valuable tool for businesses and organizations looking to predict trends and patterns in their data. By using techniques such as regression analysis, time series analysis, and clustering, analysts can uncover insights, make predictions, and identify areas for improvement. By leveraging the power of statistical analysis, businesses can make informed decisions, optimize their operations, and stay ahead of the competition. If you are looking to predict trends and patterns in your data, consider using statistical analysis to unlock the hidden potential in your data.